How to analyse frequency and temporal responses

Frequency response
In professional monitoring, with the loudspeakers and the listener at standard positions, there is but one reasonable requirement of the reference frequency response: it must be perceived-flat. It’s important to understand that the listening level will affect the perceived response, and the room, listening distance and placement will also be of influence.
GLM’s AutoCal 2 calibration algorithm combines known information about the monitors in the system with measured room data and standard listening levels – which should on average be between 70 and 80 dB SPL. GLM is excellent at estimating the compensations needed for the monitoring system to convey a perceived-flat frequency response. The GRADE report adds a refined understanding of your room and setup, and it is good at spotting potentially problematic reflections – so you have a chance of reducing them specifically, rather than altering the entire on-axis and off-axis frequency response.

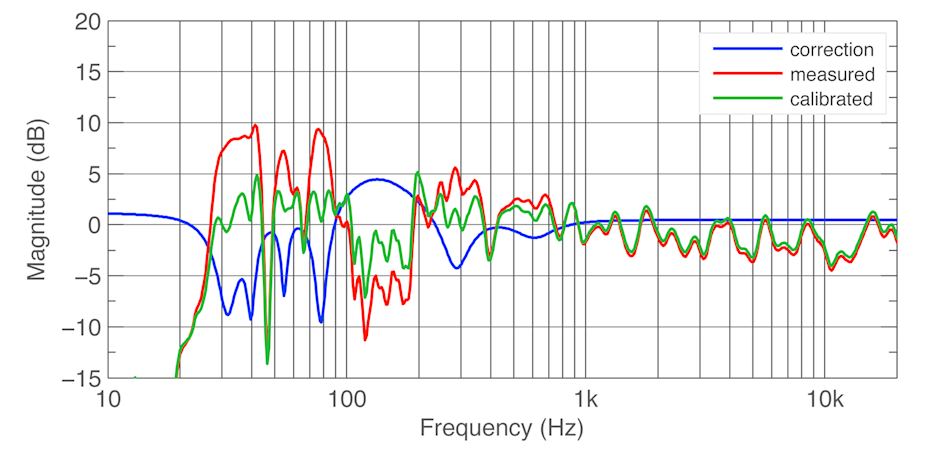
Fig 1. Example from GRADE showing the frequency response for an 8351B.
For instance, Fig 1 shows the frequency response for an 8351B monitor at 2.5 m listening distance, where we can observe both positive (peak) and negative (notch) boundary loading below 300 Hz. Within the GRADE report itself this is marked as Fig 3.1, where the red curve shows the measured frequency response before compensation. Table 3.2 within the report specifies what effect the room has on LF extension, which can also be seen in the graph above. Note that the -6 dB cut-off point has been extended audibly by the room, down to 25 Hz – beyond the 8351B’s own specified figure of 32 Hz.
The wide dip between 100 and 200 Hz is also highly audible, and would cause you to add high bass when mixing. In chapter 4, the GRADE report shows specific reflections that influence performance, and it gives distance in both cm and inches, so you can identify and maybe improve any issues. In this case, floor and backwall reflections were the main influencers (two common offenders), so ideally you would make physical changes to them. However, GLM deals quite nicely with the circumstances, though causes some loss of headroom between 100 and 200 Hz.
As a general rule of thumb, for any good monitor, do not compensate frequency response more than necessary. Instead, rely also on your ears and brain to help resolve the in-room response, and be conscious about the listening level.
Temporal response
With immersive production and distribution now taking place widely, neutral monitoring of spatial quality latent in the content has taken on a whole new meaning. In audio production, the primary goal is to know what is in the source, rather than what is contributed by the reproduction room. In that respect immersive content gets distorted more easily than stereo, and with the widespread use of headphones in recreational sound, the playback room now plays a lesser role for a typical end-listener.

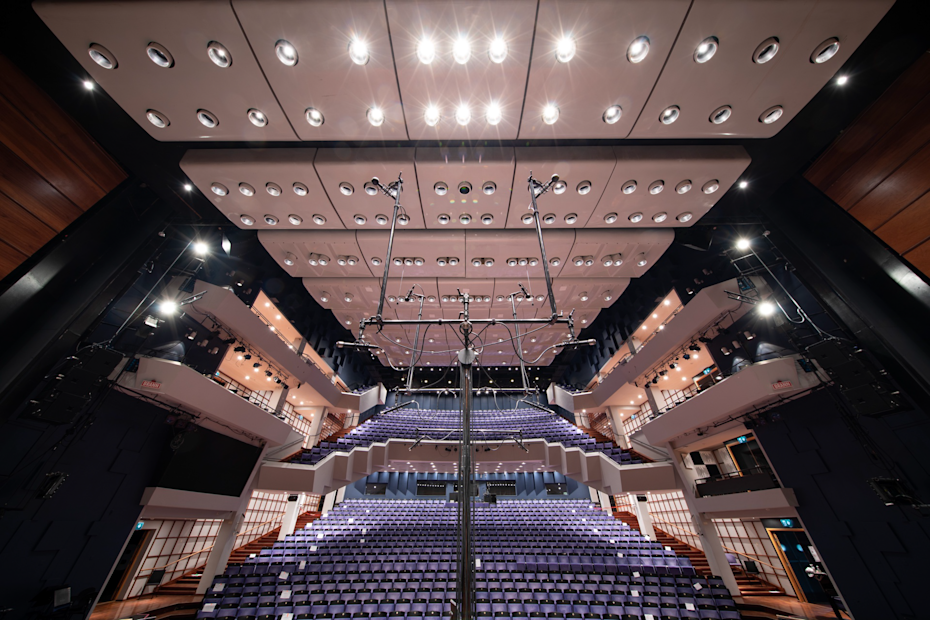
Fig 2 Mic array setup from a recording in Trondheim, Norway.
One of the most revealing measurements in GRADE relates to this subject directly, and analyses the early and late sound level ratio vs frequency. Condensed early/late metrics are already used when measuring speech intelligibility, but when resolved against frequency they become useful in monitoring also.
With both stereo and immersive, for your room and system to be able to reliably convey the envelopment latent in the content, perceived-direct sound should dominate in the 50 to 700 Hz range – where audible patterns characteristic of the recording space may have been picked up. If they have, you can be sure that the recording engineer has gone to great lengths in doing so. Fig 2 is a recording setup in Olavshallen in Trondheim, Norway, and shows a main mic array with sufficient distance between capsules to capture LF differences and moving patterns – two of the most precious qualities of a hall to preserve. As a start, GRADE reveals whether you will be able to hear it in your room, in case it is there.

Fig 3 Example from GRADE showing a monitor’s ability to convey envelopment.
Fig 3 shows the GRADE graphs from section 4.3 of the report, and reveals a monitor to the left which is able to convey envelopment latent in the content; and one to the right that is less able to do so. If listening to the latter, you are unable to judge recorded space precisely. Such ability may also be sacrificed when relying on bass management with only one subwoofer to reproduce all LF sound, rather than multiple channels and acoustic in-room summation. If possible with delicate content, don’t use a higher bass management cross-over frequency than necessary, and preferably below 60 Hz.
In conclusion, the GRADE report provides valuable information about your unique room and your monitoring system, including possible limitations to conveying every detail of stereo or immersive content in a neutral way. Some visible imperfections can be mitigated with the help of GLM, some require physical change to monitor placement, some call for an acoustic consultant, and some are best left alone. Remember to also use your ears!
If you are already a GLM user then you can find out how to obtain your GRADE report here, and to learn more about GRADE please click here.
About the Author

Thomas is one of the fathers of the loudness and peak-level measurement standards used widely from music production over streaming and broadcast to OTT. Perception has been at the centre of his professional life, working first as a physician and then in pro audio research. Thomas has written a number of papers; he is senior technologist at Genelec, and is the convenor of an EU expert group tasked with the prevention of recreational hearing loss.
